Matplotlib从入门到精通:Axes与Axis(三)
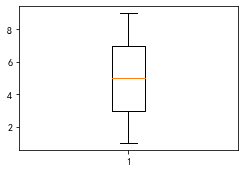
箱型图fig, ax = plt.subplots(figsize=(3.5,2.5), tight_layout=True) x = [1, 3, 5, 7, 9] ax.boxplot(x)雷达图使用极坐标系{'projection':'polar'}fig, ax = plt.subplots...
Matplotlib从入门到精通:Axes与Axis(二)
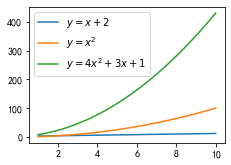
使用图例后面会专门出一期图例的推文,这里先暂时了解一下fig, ax = plt.subplots(figsize=(3.5,2.5)) x = np.linspace(1, 10) ax.plot(x , x+2, label='$y=x+2$') ax.plot(x, x*x, label='....

Matplotlib从入门到精通:Axes与Axis(一)
上一篇,我们讲了Figure层面的一些操作,本篇我们主要聚焦在Axes层面,做一些操作。首先,导入画图必须包import numpy as np import matplotlib.pyplot as plt在matplotlib中如需显示中文和负号的需求,则需要添加下面两行代码# 解决中文不显示的...
本页面内关键词为智能算法引擎基于机器学习所生成,如有任何问题,可在页面下方点击"联系我们"与我们沟通。
社区圈子

Matplotlib您可能感兴趣
- Matplotlib线图
- Matplotlib库
- Matplotlib pandas
- Matplotlib python
- Matplotlib案例
- Matplotlib numpy
- Matplotlib方法
- Matplotlib数据可视化
- Matplotlib图形
- Matplotlib美观
- Matplotlib参数
- Matplotlib绘图
- Matplotlib函数
- Matplotlib代码
- Matplotlib设置
- Matplotlib数据分析
- Matplotlib直方图
- Matplotlib图
- Matplotlib图表
- Matplotlib折线图
- Matplotlib可视化
- Matplotlib属性
- Matplotlib散点
- Matplotlib入门
- Matplotlib散点图
- Matplotlib饼图